A Computational Reading of a Birth Stories Community
A few years ago, some personal friends of mine shared their birth stories online. Their stories were both surprising and inspiring to me. One of those stories described a traumatic birth, and I was shocked at both the story itself and the courage of my friend in sharing these details. This experience got me started reading birth stories online, and I’ve found that each story is unique and full of strength, emotions, and decision-making.
I became interested in the similarities and differences between these stories, and how these stories sometimes follow common narrative patterns. I thought that these stories were extremely powerful, and that presenting and centering these stories could help medical professionals better understand the experiences of pregnant people—and perhaps this improved understanding could, in some small way, help to prevent trauma, disappointment in the birthing experience, and postpartum depression.
Data Collection
I downloaded all the public posts from the subreddit r/BabyBumps from February 16th, 2011 to February 28th, 2018 that contained the words “birth story” in the post title. This left me with about 3,000 birth stories. I include only the public post title and text.
I never shared this data with anyone else, and I’ve since deleted my own copy of the stories. All of the results in the paper are either paraphrased or averaged, and I never share any identifiable information. I know that these stories are intensely personal, and throughout the project, I’ve worked hard to respect the privacy and ownership of the authors and follow the principles of ethical research as outlined in the Belmont Report. I welcome any questions and/or feedback about the data collection, management, and analysis involved in this project!
Analysis
I used a computational technique called topic modeling to explore the typical sequences of events in birth stories. Basically, the computer looks for patterns in the cooccurrence of words in the stories to automatically identify “topics” or “themes”. The results are ranked lists of words, with the top words representing each topic. I don’t tell the computer ahead of time which topics to look for—it finds the topics by itself!—which is what makes this technique so cool.
I examine which topics are more likely to occur at the beginning, middle, and end of the stories. Some of these are obvious (e.g. the baby is usually born near the end of the story) while others are specialized for this subreddit (e.g. many stories begin with a kind of “meta” topic about birth stories and the author’s motivation in sharing their story).
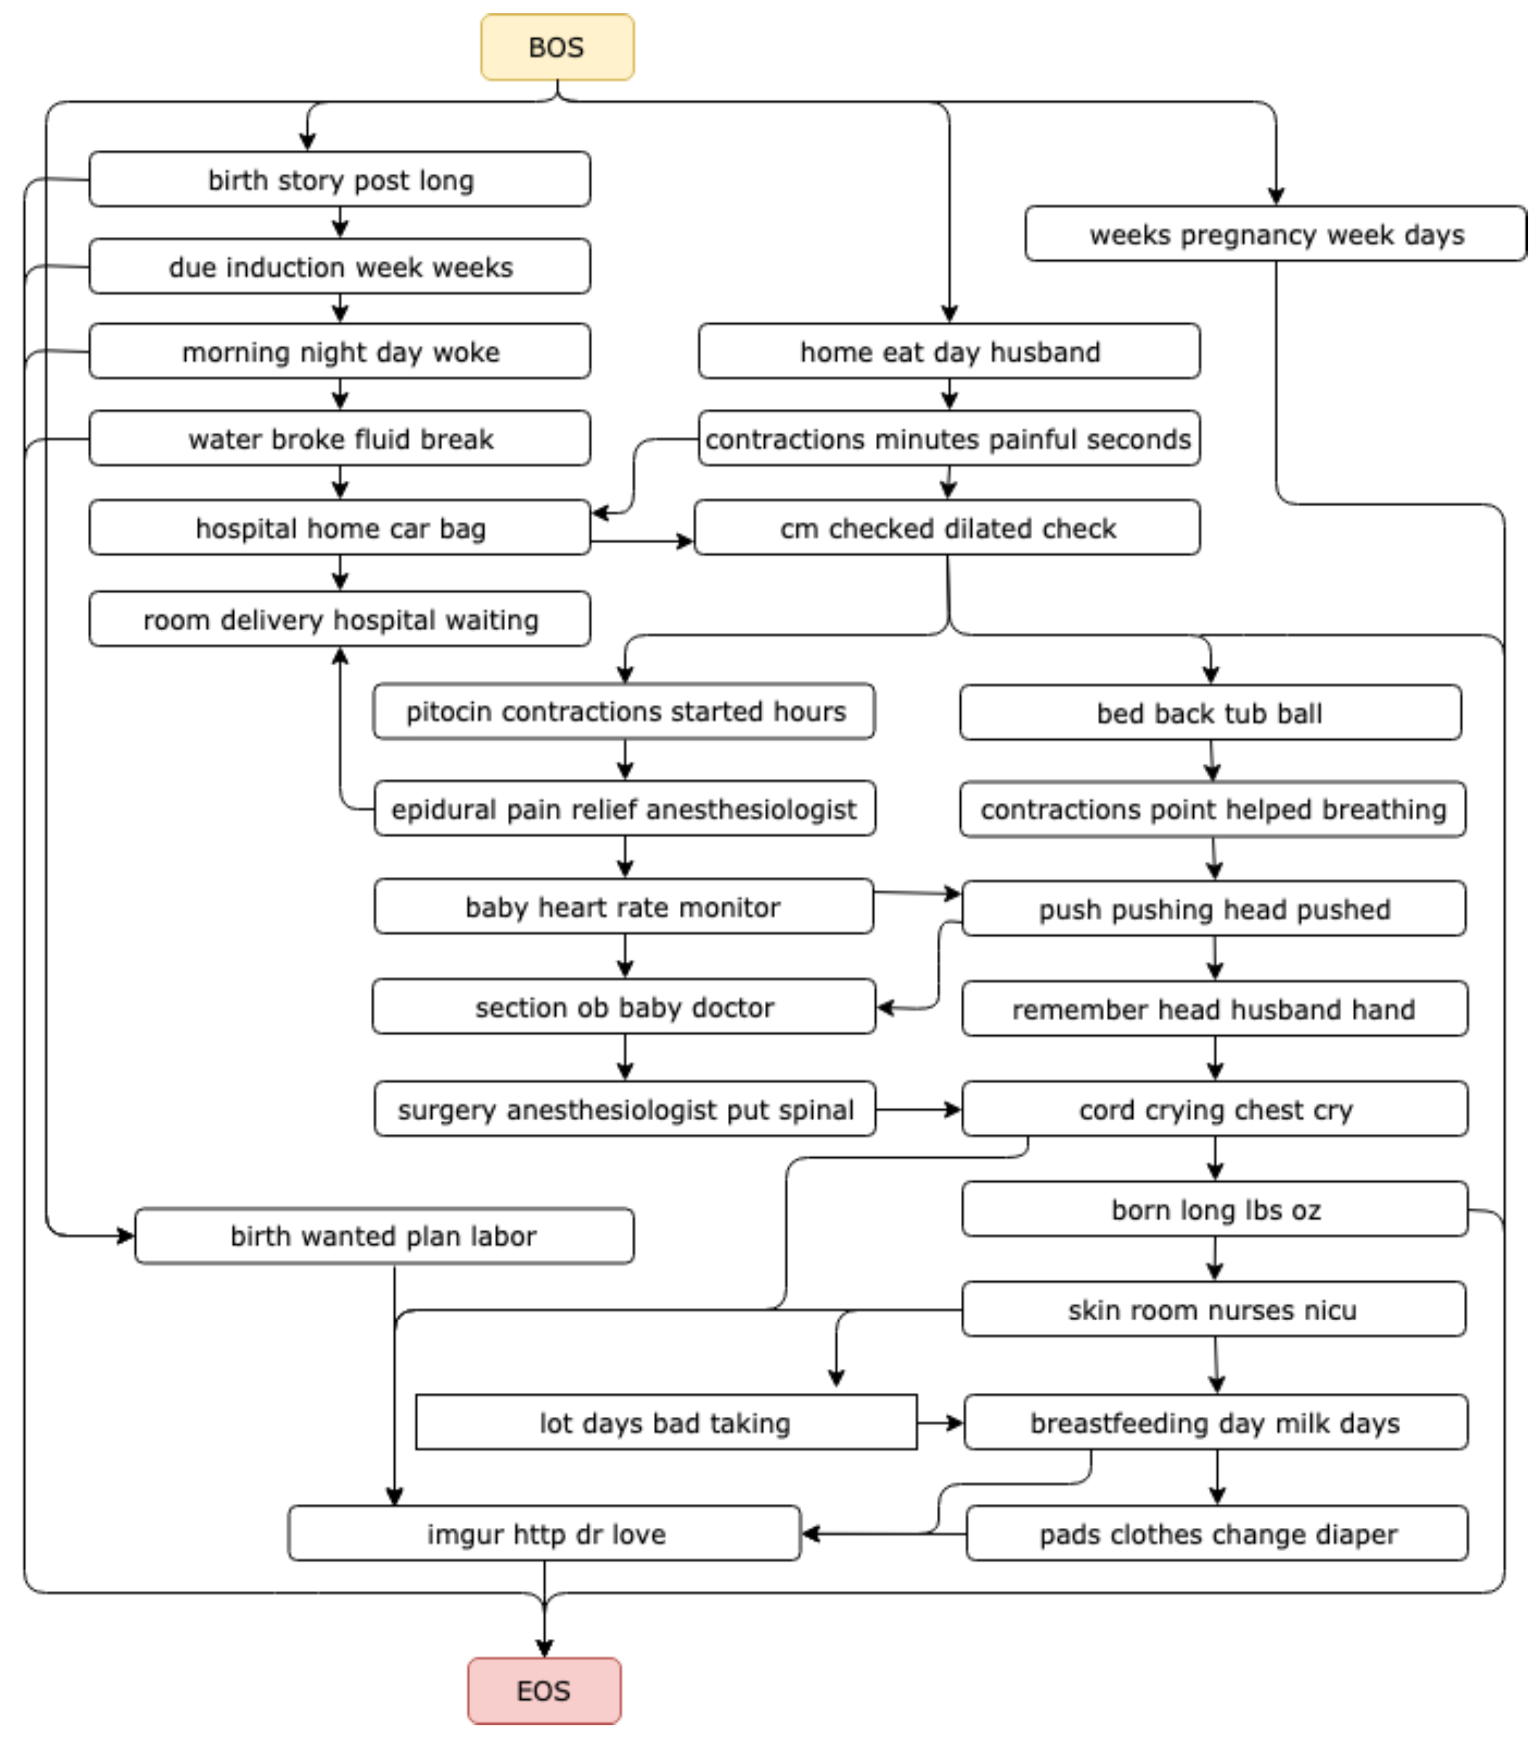
In the figure below, I’m showing a map of the topics. At the top of the figure are topics that are likely to be discussed at the beginning of the stories, and at the bottom of the figure are topics that are likely to be discussed at the end of the stories. The arrows show the most probable pathways between the topics according to the model; for example, if the second paragraph of the story is discussing water breaking, then the next paragraph is very likely going to discuss going to the hospital. Again, the topics and arrows are learned automatically, using just the stories.
One thing I’d really like to highlight in this figure is that there are multiple diverging pathways in these stories. There’s no one “right way” to give birth, and the dataset of stories demonstrates that.
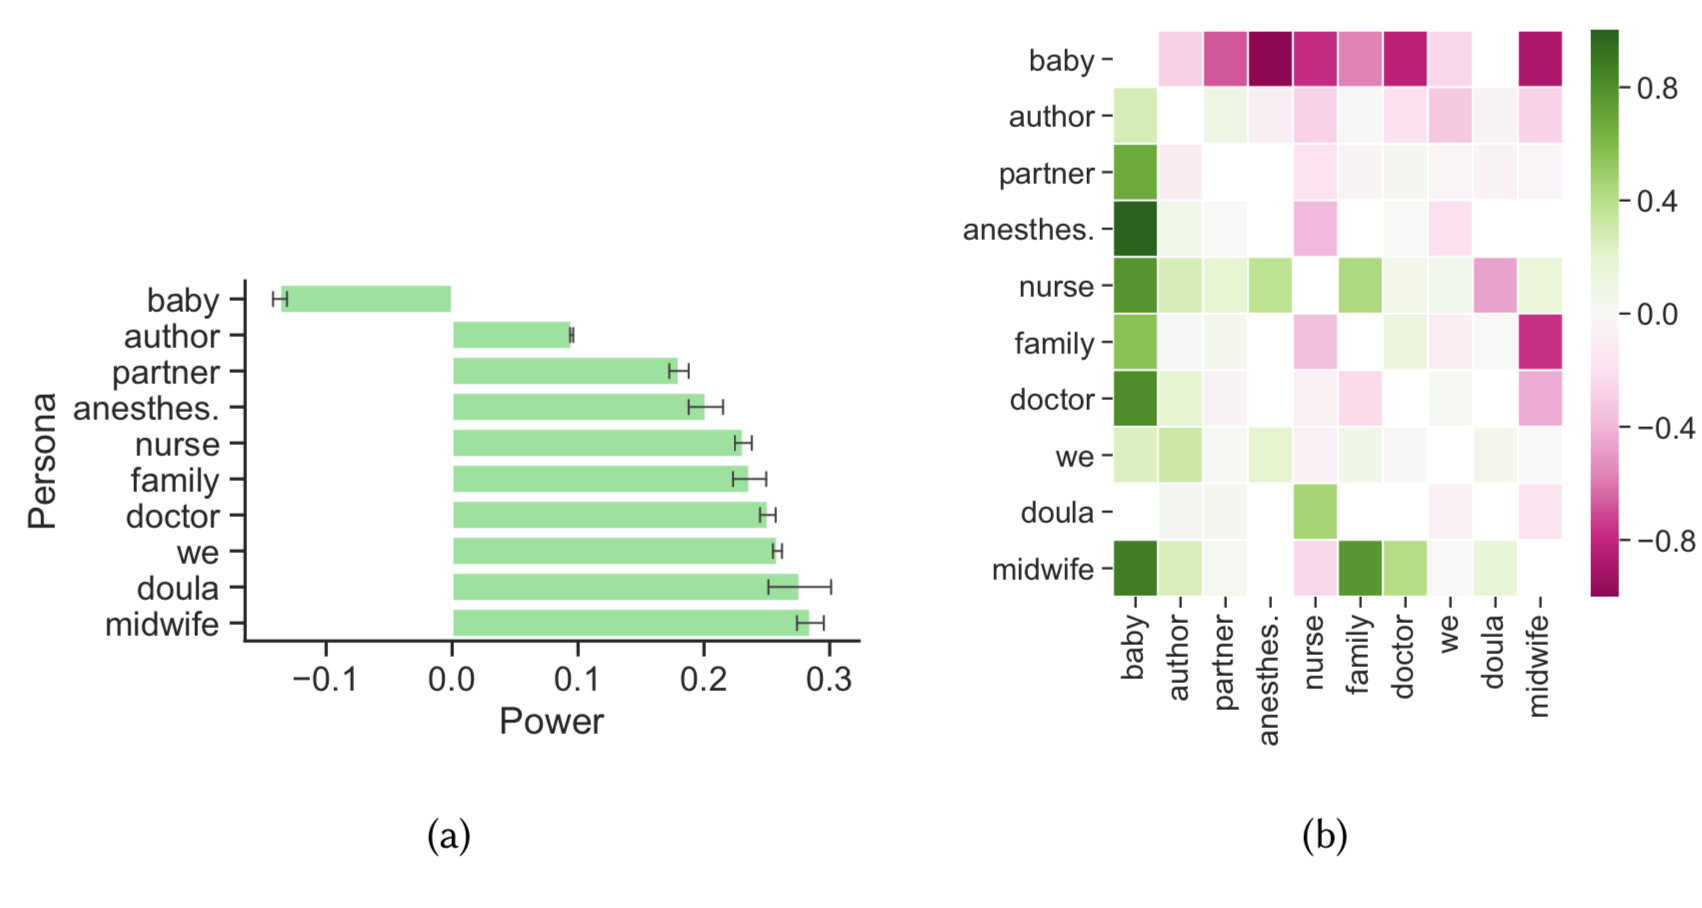
I also explored the power dynamics between different personas in the stories (e.g. doctor, midwife, partner) using an annotated dictionary of verbs. Unsurprisingly, the baby is usually framed as having the least amount of power in these stories, while the medical professionals have a lot of power. Perhaps unexpectedly, authors of birth stories often frame themselves as having very little power, while the doula and midwife are framed as having a lot of power. For example, only the doula is framed as having more power than the nurse.
Figure (a) shows the total power scores for each persona, while Figure (b) shows the relational power score between pairs of personas. Green indicates a higher power score, and pink indicates a lower power score.
Conclusion
Some of my results confirm work from prior qualitative studies of birth stories, but as far as I know, this is the first time someone has published a computational analysis of birth stories. There is much more information in the full paper.
My hope is that medical professionals and researchers will listen to the voices in these stories. They deserve our attention!
November 05, 2019